Unveiling Bitcoin’s Seasonal Patterns: Predictable Price Trends from 2018 to 2024
Sukrit Sunama 10 months ago

When I first observed this pattern, I felt a chill run down my spine—it was hard to believe how accurately the month impacts Bitcoin's price movements. But trust me, data doesn't lie. In this article, I'll walk you through fascinating insights I’ve uncovered through data science.
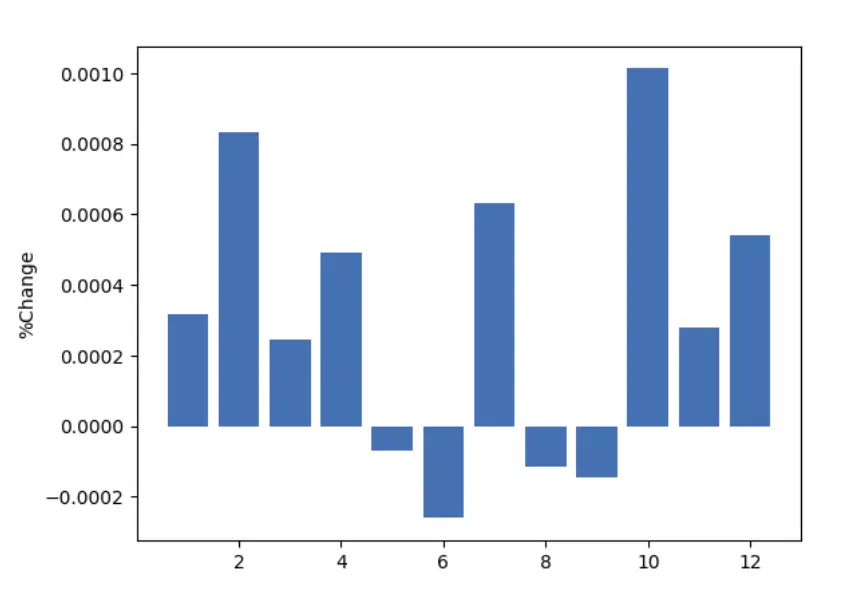
BTC 4h, Month and %Change between 2018 - 2024

From the graph plotting the relationship between months and the average percentage change in Bitcoin's 4-hour price movements, a clear pattern emerges. During January to April, July, and October to December, the values are consistently positive, indicating upward price trends. Conversely, during May to June and August to September, the values turn negative, signaling downward price trends. Remarkably, this pattern has repeated every year from 2018 to November 2024.
This means you shouldn’t blindly trust news, influencers, or hype around sudden crypto booms or crashes—because this seasonal pattern is a recurring phenomenon.
Histogram grap of percentage price changes

Looking further into the histogram graph of percentage price changes, I noticed an intriguing bell-shaped distribution. Although the shape is somewhat spiky, it suggests that Bitcoin’s price movements resemble a normal distribution. This implies that Bitcoin's price trends are not only consistent but also statistically predictable to some extent.
In conclusion, Bitcoin's price behavior is strongly influenced by global financial cycles, making its movements somewhat predictable. My research extends beyond Bitcoin and the crypto market, and I’ve found similar annual patterns in other financial markets too.
Stay tuned for more discoveries, dear readers. See you in the next article!